![]()

2018 Year in Review
2018 – Year in Review
Happy New Year!
We hope that the first few days of the new year find you doing well. With 2018 now behind us, we reflect on what a blessed year it has been and how thankful we are to be able to serve each of you on your financial journey. The turn of the year finds us reviewing our processes and the tools we use to help you down your financial path, so we thought it would be a good idea to put together a brief recap of 2018 to help put things in perspective.
The S&P 500 index ended 2017 at 2,673.61 and by the end of January it had risen to 2,823.81. February brought our first pull back as the index fell to 2,581.00 at its lowest point on February 8th – a 9.4% drop.
Spring and summer saw a few half-hearted attempts to move forward, and the index saw its highest point of the year – and a new all-time high – at a closing point of 2,930.75 on Thursday, September 20. By late fall we began to see a downward shift leading up to the election, and despite a few spikes in November and December, the markets continued to see further erosion in stock prices into the holiday season.
December brought our usual ‘Santa Claus Rally’ with an attempt to rebound in the last week of the year, but the calendar turned with the index at 2,506.85, down approximately 6.7% on the year. The bottom three equity sectors of 2018 were energy down 18.5%, materials down 15.4%, and industrials down 14.2%. A good reminder of why our philosophy is not to overweigh our investments in any one industry or sector.
Interest rate increases in the mid and latter parts of the year had a negative effect on our income positions from a share price standpoint, but the income continues steadily. For that, we are thankful.
Although the figures above are perhaps not what we’d like them to be, the year 2018 has been normal in many ways.
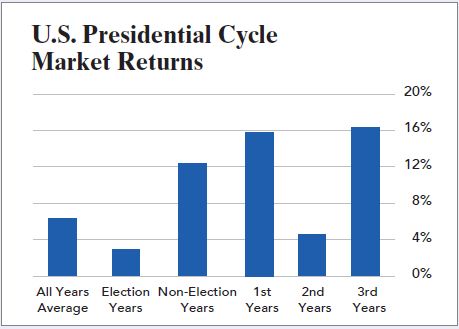
Above is a chart prepared by Matthew Carr that shows how the 2nd year of a president’s term – the one that for us has just ended – has historically been one of the worst years in the markets during the presidential cycle. In the past 72 years, there have been 18 midterm elections, and in every case since then the S&P has been higher one year later. It didn’t matter who was in the White House or who controlled congress.
If history is any guide, this means 2019 could bring a welcome tailwind as we head into the 3rd year of the current presidential term – which has been historically the best year of a presidential cycle for the markets since 1989.
Looking Forward to 2019:
In 2019 we will continue to be diligent with our position choices, position sizes, and stops, to try and give us an advantage in growth and protecting our capital.
We will continue to try and anticipate the market, and then react with a goal of reaching your income needs, tax efficiency, and capital appreciation goals within your risk tolerance.
As we move forward and look for the correct balance for your accounts, we will also be talking to you about some opportunities available in the registered investment advisory world and utilize the many tools we have to help you reach your goals.
These opportunities include not only stocks in publicly traded companies, but bonds, Master Limited Partnerships (MLP’s), Real Estate Investment Trusts (REIT’s), CD’s, Fixed Indexed Annuities, and cash as an asset class to have funds available to invest after a pull back.
As always, we thank you for trusting us to work on your behalf. We are looking forward to an even brighter New Year and wish you all the very best throughout the coming year.
Sincerely,
Rod, Sue, Loretta, & Jenna
References:
Carr, M. (2018, December). Emerging Trends Strategist. Why Three Is Better Than Two, p. 1.